2006 AMANDA Point Source Analysis
Event Selection
Methodology, Sensitivity & Discovery Potential
Unblinding Proposal
Results
Questions and Answers
 |
| NASA/ESA Hubble |
Data Sample
2006 data filtering is identical to 2005 Data Filtering
The 2006 L3 Upward-Muon Sample
Location
- Slart: /data/exp/AMANDA/2006/filtered/reco/L3_st
- F2K: /data/exp/AMANDA/2006/filtered/reco/L3_f2k
2006 Fit Numbering (F2K)
| FIT 0 | CFirst | FIT 1 | JAMS | FIT 2 | DW | FIT 3 | WIMP | FIT 4 | Cascade SPE | FIT 5 | Cascade MPE | FIT 6 | Muon Pandel single-fold SPE | FIT 7 | Muon Pandel 32-fold SPE | FIT 8 | Paraboloid | FIT 9 | Muon Pandel 16-fold MPE | FIT 10 | Bayesian 16 | FIT 11 | Bayesian 64 |
2006 Passing Rate
| Livetime (after file selection) | 186.95 days |
| Total L3 Events (after file selection) | 4.89M |
2006 IceCube-9 Flasher Runs
Elimination of IceCube flasher runs proved more challenging in 2006 due to the very large number of runs and incomplete logging. Flasher runs were compiled from a PSU C&V log and testdaq log files. The following is a table of run periods between Feb. 15 and Oct. 31 2006.| Start Time | End Time |
| Feb 26 11:16:00 | Feb 27 17:48:22 |
| Feb 28 07:34:32 | Feb 28 20:46:44 |
| Mar 1 16:22:18 | Mar 1 16:27:23 |
| Mar 2 07:27:29 | Mar 2 20:15:49 |
| Mar 3 07:01:41 | Mar 3 14:00:27 |
| Mar 4 07:42:14 | Mar 5 03:26:42 |
| Mar 5 15:07:47 | Mar 5 23:19:09 |
| Mar 6 12:42:41 | Mar 6 21:50:56 |
| Mar 8 07:31:04 | Mar 9 20:27:11 |
| Mar 10 17:22:25 | Mar 11 01:00:00 |
| Mar 14 15:16:42 | Mar 14 19:21:59 |
| Mar 15 16:35:51 | Mar 15 20:08:45 |
| Mar 16 06:13:13 | Mar 16 06:24:53 |
| Mar 22 14:01:46 | Mar 22 16:05:20 |
| Mar 30 05:46:13 | Mar 30 07:40:56 |
| Apr 3 06:55:03 | Apr 3 22:05:55 |
| Apr 5 05:01:39 | Apr 5 23:27:19 |
| Apr 6 07:07:30 | Apr 6 07:30:00 |
| Apr 13 04:53:21 | Apr 13 22:13:45 |
| Apr 16 04:21:06 | Apr 16 22:00:44 |
| Apr 21 06:36:46 | Apr 21 22:09:04 |
| May 3 03:18:50 | May 3 22:34:36 |
| May 13 02:44:31 | May 13 03:05:15 |
| May 14 03:02:11 | May 14 04:55:27 |
| Jun 1 01:29:34 | Jun 1 02:15:00 |
| Jun 7 03:52:03 | Jun 8 00:09:10 |
| Jun 16 02:00:01 | Jun 16 03:30:00 |
| Jun 25 23:55:22 | Jun 26 22:21:47 |
| Jul 6 23:02:10 | Jul 6 23:30:00 |
| Jul 7 03:55:49 | Jul 7 05:33:24 |
| Jul 11 22:31:27 | Jul 12 22:20:12 |
| Jul 20 21:45:57 | Jul 21 08:03:51 |
| Jul 31 03:24:12 | Jul 31 22:00:00 |
| Aug 9 20:54:00 | Aug 9 22:10:00 |
| Aug 17 20:12:10 | Aug 17 21:25:00 |
| Aug 21 19:53:08 | Aug 21 21:20:00 |
| Aug 21 23:21:00 | Aug 22 19:27:52 |
| Sep 5 18:55:00 | Sep 6 03:38:31 |
| Sep 26 01:26:00 | Sep 26 01:59:27 |
| Sep 29 18:11:25 | Sep 30 10:53:00 |
| Oct 19 22:38:35 | Oct 20 15:30:36 |
| Oct 26 17:45:34 | Oct 26 23:36:43 |
The flasher cuts are graphed below along with those used in the Zeuthen 2006 analysis and the difference between the two sets of cuts.
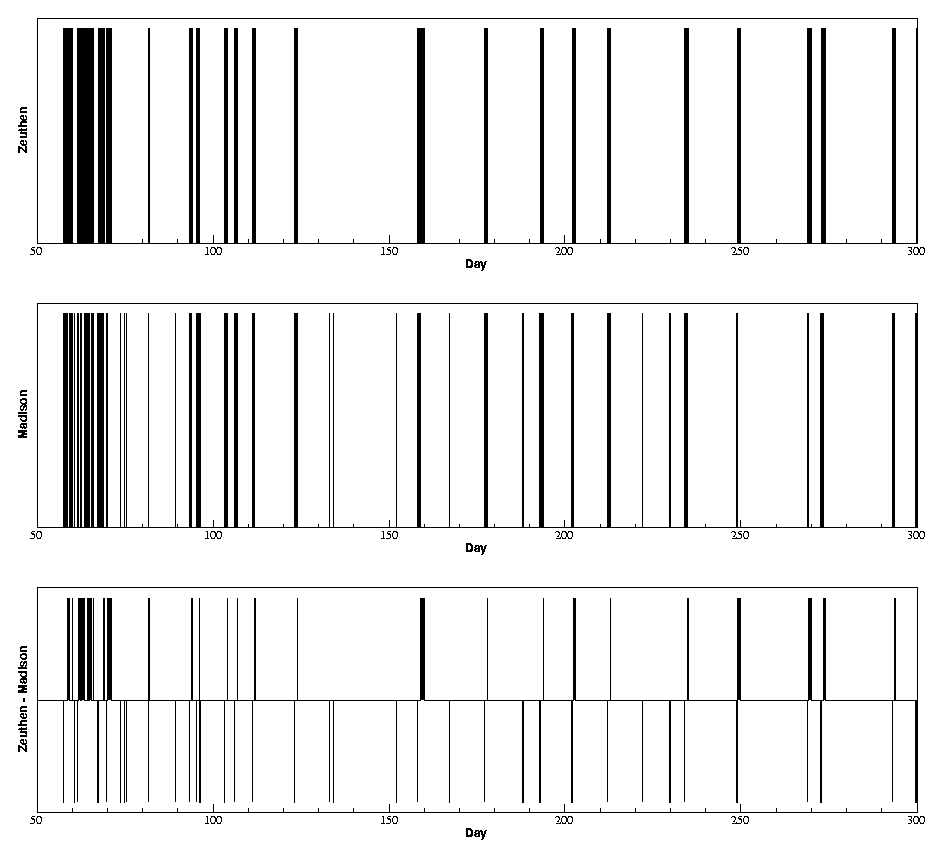
The sets of cuts are similar, but show minor differences. The periods cut by this analysis and not by Zeuthen are mostly non-flasher TestDAQ runs. It is clear from the above plot how often we took flasher data in 2006!
To evaluate the L3 sample for possible contamination with IC-9 flasher runs, the L3 event rate is plotted in 1000 second bins, which is similar to the length of a typical flasher run.
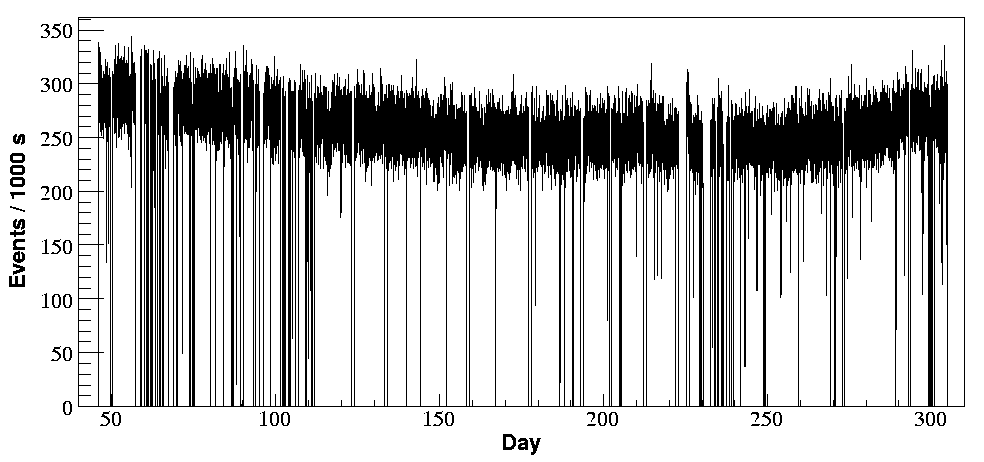
No unusual rate spikes are observed. Drops in rate are peroids where files have been rejected. The change in mean rate is due to seasonal atmospheric variations.
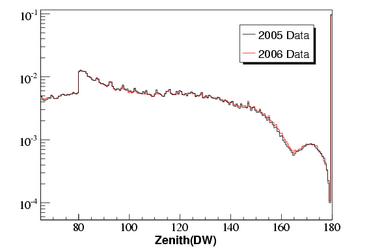
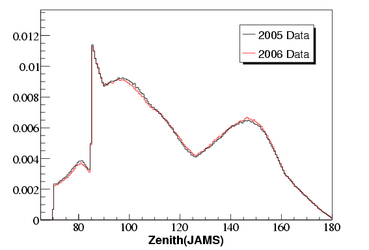
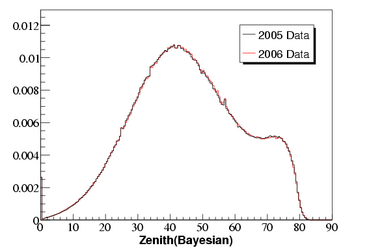
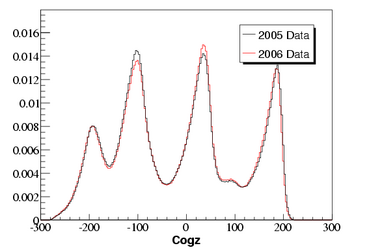
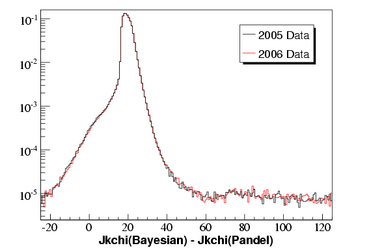
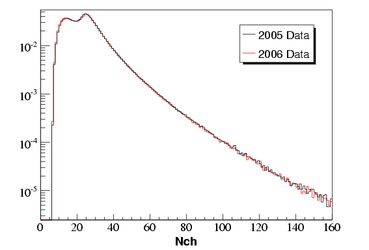
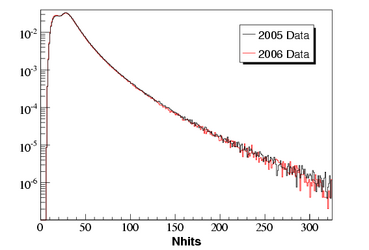
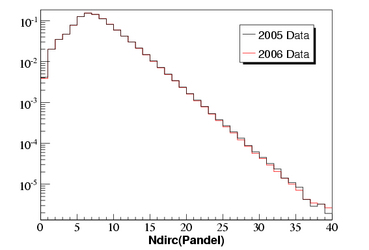
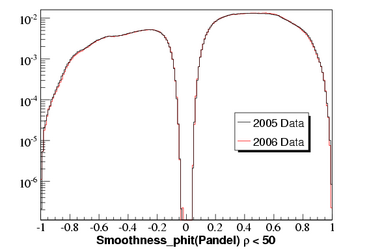
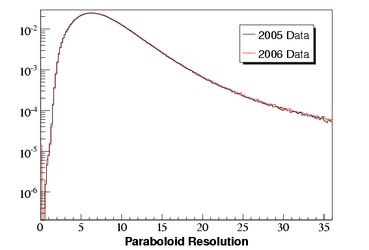
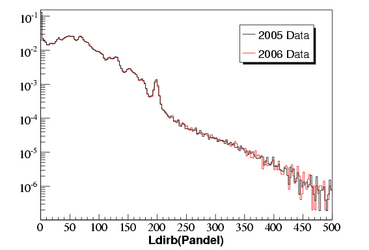
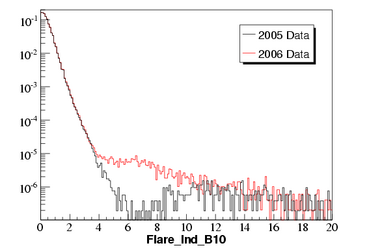
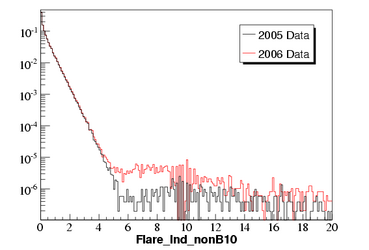
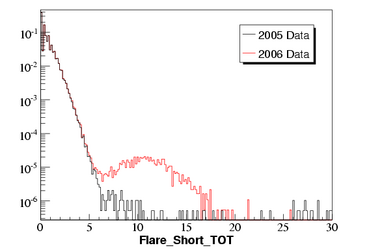
Comparison to 2005
Comparison plots include AMANDA string-trigger-only events, present in the L3 stream for 2005 and 2006.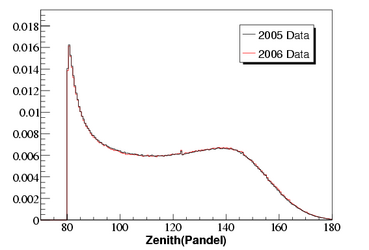 |
 |
 |
 |
 |
 |
 |
 |
 |
 |
 |
 |
 |
 |
 |