2006 AMANDA Point Source Analysis
Event Selection
Methodology, Sensitivity & Discovery Potential
Unblinding Proposal
Results
Questions and Answers
 |
| NASA/ESA Hubble |
Questions and Answers
8/29/07
Q: Hi Jim, it's almost spooky how well the data from 2005 and 2006 match! I would suggest a slightly modified flare cleaning. As the indicators were defined, each indicator should have an individual cut. All indicators should also be plotted, because they look for different kinds of misbehaviour.A: It is difficult to justify changing the cut since it was used in 2000-2003 muon analyses (point source, diffuse, galactic plane at least) and the filtering for 2005-2006 is very similar. The cut also appears to be working since the cut variables have nicely exponential tails. The distributions of flare variables are on the event selection page.
9/5/07
Q: Elisa B. expressed concerns about data quality in 2006.A: After thorough file selection, all flasher periods appear to be eliminated. Evidence of this includes:
No azimuth or GPS day spikes in the final sample:
 |
 |
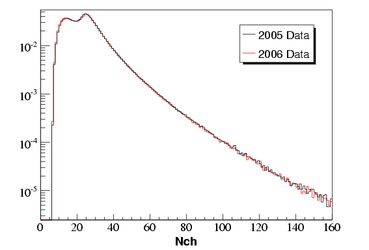
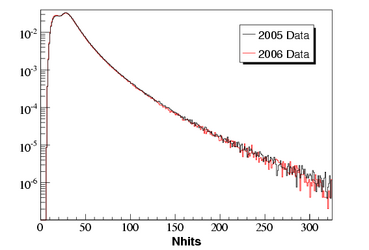
Nch and Nhit distributions have clean tails:
 |
 |
No spikes in the L3 filter rate throughout the year:

However, at least two short drops in L3 rate are observed. The drops correlate with a sudden ~20% decrease in AMANDA raw trigger rate. Approximately 60 files (0.17%) are affected. We feel excluding these periods is not warranted because
- Events are lost, not added (e.g. flasher runs) to the sample. We understand the nature of the remaining events.
- The drops cause a ~30% reduction in L3 data rate. This represents a 0.17%*30% = 0.05% loss of data, which is insignificant for a time-integrated analysis.
The two rate drops near day 236 (run 10019) and near day 297 (run 10097) have been investigated. There are trigger alarms during run 10019, mostly because the period is generally unstable and the detector briefly returned to normal during this run. Several OMs were brought back from near-dead during this period. The relative trigger rates changed considerably. The run has several files with a high flary event fraction.
http://butler.physik.uni-mainz.de/amanda-monitoring/cgi/shifttourmain.cgi?year=2006&day=236&run=010019
The rate drop in run 10097 is likely due to a sudden increase in flary event fraction:
http://butler.physik.uni-mainz.de/amanda-monitoring/cgi/shifttourmain.cgi?year=2006&day=297&run=010097
9/10/07
Q: It seems that in 2005 the zenith angle distribution (indeed to be precise the rate of events) agrees better with Honda. In the 2000-2004 we found instead a better agreement with Lipari, which it seems you find back in 2006. Do you know where the different behavior of 2005 comes from? Do you have something like table table II of the paper http://arxiv.org/abs/astro-ph/0611063 to see if there are differences in the energy distribution? maybe related to the question above: is it understood why the normalization factor is so much different for 2006 compared to 2005 and the 5 years paper? http://www.icecube.wisc.edu/~jbraun/2006_point_source/cuts.html Is your conclusion a statistical fluctuation?A: The normalization for 2006 is 0.94, compared to 0.82 for 2005. I do conclude this difference is a statistical fluctuation because the normalization difference persists at the tightest cut levels. Also, the uncertainty on the normalization factor is about 3.5%, so the two normalizations could reasonably be produced by a true flux higher than that suggested by 2005, but lower than 2006.
Q: do you have some details on the MC approach, for example plots which show the probability P(Nch|gamma).?For the ICRC there was not time for it. maybe you have some more documentation now?
A: Sure. The plots are in my ICRC proceeding and 2005 unblinding page:
http://www.icecube.wisc.edu/~jbraun/2005_point_source/methodology.html
Q: elimination of Flasher events: my comment is that the plots of events versus gpstime and azimuth not necessarily allow to identify residual flasher events. The first one (gpsday) should be replaced by the rate of events (as I wrote to you already). The azimuth also might now help. Events should have strange peaks in zenith (see for example in http://www-zeuthen.desy.de/~rfranke/online.html that for you could show up for example at cosine between -0.8 and -0.7 I do not say you might have residual flashes, just that the two plots shown are not ideal indicators. I think you should show the rate at final lever (correcting each day for the effective time after file selection) as a cross-check. Also, I am not sure if flasher events would show up in the tail of NHits and Nch. I think they should rather show strange topologies. The problem we are interested at is at high levels and can easily be hidden at the L3 plots.
A: It is hard to believe events would show up in zenith but not in azimuth. Flasher events surviving to L3 also tend to be large and really do show up in Nch and Nhit. The event rate at final cut level and Zenith > 100° is shown below:

Q: on run 10097 and the few files with dropped rate: you say that you think this is not a problem since events are missing and not added. I think this might be a dangerous argument, since whenever the DAQ cannot cope withe the increased rate (and you have for example dramatic changed in the deadtime, you cannot really trust what is written out). You write that you understand the nature of the remaining events. Maybe you could add explanation of the checks that you did for those and then all will be cleared.
I do not claim to understand the nature of the remaining events. I do not understand why events should be condemned due to a slight DAQ misbehavior. There are 5 events with zenith > 90 degrees during the affected periods, which include both normal files and reduced-rate files. Any added background should not significantly affect the point source analysis, with an already large background of ~900 atmospheric neutrino events. However, I am certainly willing to eliminate these periods if collaborators are uneasy with using them.
Q: on http://www.icecube.wisc.edu/~jbraun/2006_point_source/sensitivity.html i notices that you have the plot for 2005 instead of that for 2006
No. This plot is indeed for 2006.
Q: this is just a side question: you mention that a bug was found in Sieglinde concerning the paraboloid. Do you know if this would have any effect on the agreement/disagreement between data and Monte Carlo?
A: No. The bug only affects the paraboloid ellipse rotation angle, which is not used in quality cuts. The cut variable, sqrt(err1*err2), is not affected.