2005 AMANDA Point Source Analysis
Simulation
Event Selection
Methodology
Sensitivity, Discovery Potential, & Systematics
Unblinding Proposal
Results
Questions and Answers
 |
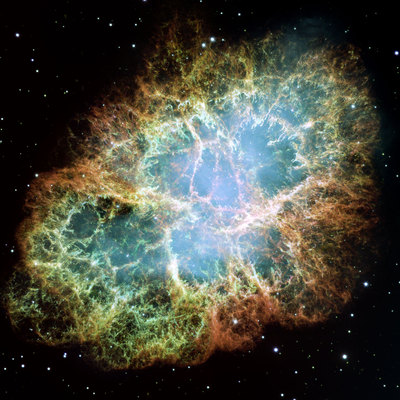
| NASA/ESA Hubble |
Questions and Answers
4/26/07
Q: I guess the optimization of the cuts was done independently for each cut. I would like to read some more details (done after all other cuts were optimized ...). I would have also smoothed the "optimal bin radius".A: The optimization was done simultaneously for all cut parameters. I did not want to smooth the optimal bin radius because it would decrease (marginally) the binned sensitivity and I wanted the clearest comparison possible between methods. If I was using the binned method for the analysis, I would do the smoothing.
Q: The "efficiency" looks good but it is not clear w.r.t. what this is given (trigger, level 1?). It would also be nice to compare this to the Zeuthen analysis ... The normalization is unusually low .... how was the background determined? The 2005 sample seems to suffer more from background than earlier samples and the resolution may be worse ... is this understood? I would have also done a scaling of the MC paraboloid error distribution to fit the data (in any case, this has to be accounted for in the systematic error).
A: The efficiency is E-2 with respect to trigger level. The normalization agrees with the Madison diffuse analysis and Zeuthen analysis (83%) before MC scaling and reapplication of cuts. Do you refer to the excess background for 80 < Zenith < 95? I did not explicitly require rejection of downgoing background in the optimization. I interpret this as that the optimal cut level is not so tight to allow only neutrinos.

NOTE: efficiency is with respect to L3, not trigger level
Paraboloid error will have to be accounted for...yes. However, it is a much smaller effect than for Zeuthen because paraboloid error begins to agree again with data between 3.5-4.5 degreees. My cut is mostly in this range.
Q: The illustration of the improvements due to the unbinned method is nice, but the result seems to be coincidently good as he sensitivity does not improve significantly by the unbinned approach (unless energy information is used ...).
A: Sensitivity still does improve (~15%) with the unbinned method excluding energy. I don't think this necessarily disagrees with Till's findings since this effect alone is not very large and the data sample is different.
Q: One should also remark, that the unbinned approach assumes that there are no signals in the surroundings ....Not taking individual resolutions for each track makes the discussion of systematics simpler. However, one may think of putting in the correlation of point spread function with NCH ... the resolution is much better at high NCH ... or is this included (I didn't check the reference...).
A: Other sources in the surroundings become more important in this unbinned method because high Nch events are possible. Considering the limits in the 5yr paper, I don't think this effect is important for 2005 alone, but combining many years this effect must be taken into account.
Q: Some more details on P(Nch, gamma) would be nice ... The approach sounds very reasonable and promising. Nice also to see the discovery probability plots and the plot on determining the spectral index given enough events. I can not comment in detail on the confidence belts, but a full MC approach is reasonable.
A: I do not take into account resolution as a function of Nch. I agree it would be nice and result in improvement; however, I don't think this feature could be implemented in time for ICRC.
Q: I would be nice to explain clearly what P=0.5 and P=0.9 mean ... probably the probability to see a 3 or 5 sigma effect in many experiments .. What would be reasonable to quote in a paper?
A: Agreed. Although 'P' is a somewhat common usage, "Statistical Power" would be more correct.
Q: Do you want to exclude 90-100 degrees? In one plot, the comparison between data and MC was only shown in one between 100 and 180 degrees.
A: I will not exclude 90-100 degrees...I leave them off the linear neutrino plot because I do not want to make the statement that I believe the data corresponds to atmospheric neutrinos in that region.
Q: What is planned for a paper? If we want to write a 97-2006 paper, is there any other improvement we could include (e.g. better directional reconstruction ... or have we given up on that?)
A: A 97-06 paper would be ideal. One area I'd like to improve is energy estimation...I think we can do better than Nch, but I didn't succeed with the NN method described in the reconstruction paper.